How it Works
16 March 2011
Traditional signal models work in the time domain or the time-frequency domain. We work in the time-phase domain. This is an entirely new way of representing a signal — and it unlocks a new class of analysis, categorisation, modification, and synthesis methods.
The Core Idea
In short: we use highly accurate pitch detection and a specialized coordinate transform that works for somewhat cyclic signals — a sound, a heartbeat or a vibration.
Such signals can be decomposed into:
- Phase offset — where in the 1st cycle the signal starts
- Amplitude envelope — how loud or strong the signal is over time
- Pitch — the frequency telling how fast the cycles repeat over time
- Cyclogram — the wave shape of each cycle.
The cyclogram is the interesting part. It captures the characteristic shape of the waveform and renders it as a 2D image in the time-phase plane. The result is a visual fingerprint unique to that sound.

The Simple Maths
The process has one tricky part: pitch detection at sub-sample accuracy — pinpointing the precise moment each new cycle begins.
From there, the maths is beautifully trivial: each cycle is normalised to the unit interval and embedded into the time-phase domain, making the wave shape comparable across cycles of different duration.
A continuous variant embeds the signal domain as a curve on a cylinder in 3D, with amplitude mapped orthogonal to the cylinder surface.
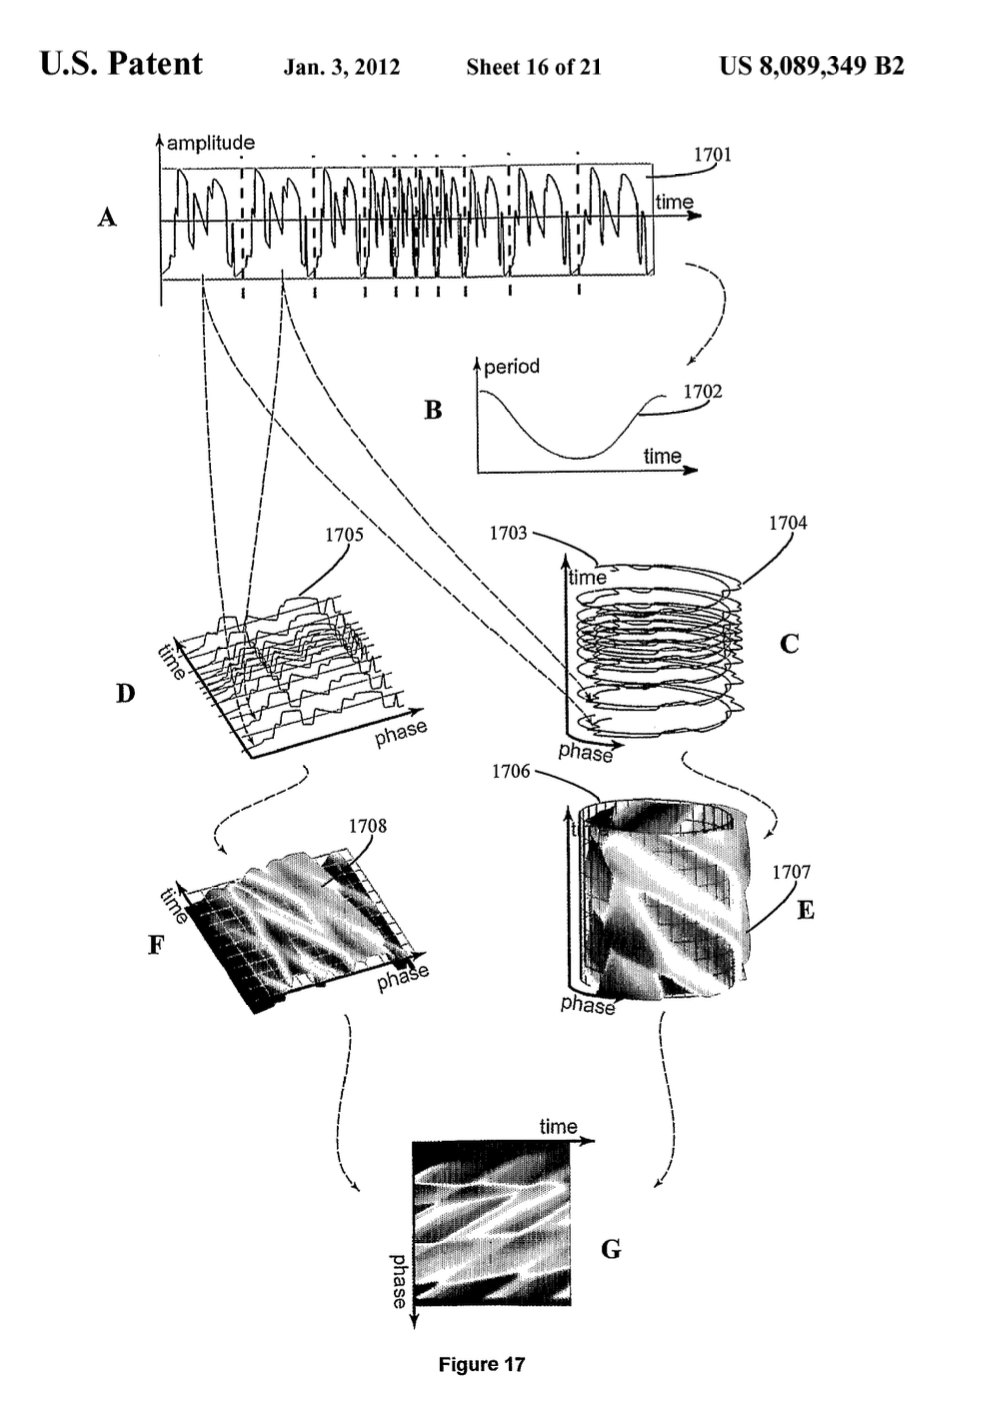
Unrolled, the cylinder yields the same 2D domain for the signal amplitude as the discrete embedding. Colour encoding then leads to the image - the cyclogram.
Given phase offset, amplitude envelope and pitch function, the transformation is lossless and reversible.
What Is The “Time-Phase Domain”?
The vertical axis of a cyclogram is phase: where we are within a cycle. The horizontal axis is time, telling us which cycle we are in.
Image-Based Signal Processing
Because a cyclogram is a 2D image, you can apply standard image processing operations — blur, sharpen, contrast adjustment — to the signal. Transform the modified image back to signal and the result is an intuitively sculpted wave shape. For audio this means image-based synthesis and effects.
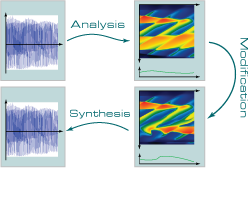
This also means existing image recognition techniques can classify and compare sounds in ways that spectral approaches cannot.
How it Differs from a Spectrogram
A spectrogram uses the Fourier transform to show which frequencies are present over time. A cyclogram shows which waveform is present over time. They encode complementary things.
- Spectrogram: time × frequency domain. Great for rough pitch and harmonic content. But phase information is lost, that is why the transform is not reversible. Colour encodes amount of frequency.
- Cyclogram: time × phase domain. Great for timbre, evolving waveform shape, and sudden or subtle variations between cycles. Colour encodes wave shape.
For signals like speech, music, ECG, or machine vibration — where the shape of the cycle matters as much as its frequency — cyclograms reveal structure that spectrograms miss.
So What Can It Do ?
A new coordinate system unlocks new capabilities. Some are familiar. Most aren’t — yet. Every image processing technique ever invented is now a candidate DSP. Every image filter, every pattern recognition algorithm and AI model is now fair game on audio — and many visual patterns are now a sound.
Nobody has run those experiments. Here’s what we know so far: image blur is a surprisingly good noise remover. Pitch tracking inside a mix hints at source separation. Synthesised images create sounds no audio synth can generate.
All this came from just poking around. That’s the thing about new tech — you don’t know what falls out until you try.
Spectrograms and FFT weren’t built in a day. This is day one. Come play.